Lucid Chart APIをたたいて(?)みた(1)
こんにちは!株式会社スマレジ、開発部のマサです。 本日はLucid Chartを触ってみたので、その備忘録です。 Lucid Chartについては、過去ブログに記載しているので、そちらを見てみてください。
Lucid Chart APIとは
公式のAPIページ www.lucidchart.com
Lucid ChartはTermプラン以上のユーザにAPIを提供しており、
- SSO用の認証
- Lucid Chart上で作成した図の離散グラフ情報や画像情報
等、様々な用途のAPIを提供しています。 今回はそのうち、図のグラフ情報を利用します。
なぜ触ろうと思ったのか
Laravelのroute機能を触っているとき、「画面遷移」がある程度決まっているなら、 routeの定義もある程度一意に記述できるのではないかと思い、図から定義を自動生成できないか と考えたのがきっかけです。
とにかく呼んでみる
APIの利用はTermプラン以上ですが、図のグラフ情報を取得するだけなら、別の方法があります。
ここの真ん中位にあるClient side debuggingに、こんな記載があります。
To see what the graph API will give you from a server side call, without having to make a server call, you can open a document in Chrome, open the javascript console (ctrl+shift+j) and type:
lucid.getGraphData()This will output an XML string of the graph data for the selected blocks and lines, or if none are selected it will output the state of the entire document.
要は「chromeのディベロッパーツール(F12)のconsoleにlucid.getGraphData()がうちこまれると、離散グラフ情報が取れるよ」というわけです。やったぜ。
スマレジもAPI利用可能なプランは少しお高めなので、管理画面からこういう風にコンソールに打ち込んで参照APIのレスポンスを試せるみたいな方法があってもいいかもしれないですね。
ちなみに、LucidChartのAPIはJSONではなくXML形式です。(実は結構古いサービスなんですかね)
例1 シンプルに矩形ふたつを矢印でくっつける
Image

<?xml version="1.0"?>
<document>
  <documentId>xxxxxx-xxxxxxxxxxx-xxxxxxxxxxx-xxxxx</documentId>
  <title>画面遷移</title>
  <version>9999</version>
  <blocks>
    <block>
      <id>pagdsxZzraNR</id>
      <class>ProcessBlock</class>
      <textAreas>
        <textArea>
          <key>Text</key>
          <value>処理1</value>
        </textArea>
      </textAreas>
    </block>
    <block>
      <id>vagdeHN-.b_S</id>
      <class>ProcessBlock</class>
      <textAreas>
        <textArea>
          <key>Text</key>
          <value>処理2</value>
        </textArea>
      </textAreas>
    </block>
  </blocks>
  <lines>
    <line>
      <id>xagd9_EZHdso</id>
      <endpoint1>
        <style>None</style>
        <block>pagdsxZzraNR</block>
      </endpoint1>
      <endpoint2>
        <style>Arrow</style>
        <block>vagdeHN-.b_S</block>
      </endpoint2>
    </line>
  </lines>
</document>
各矩形と矢印にIDが振られているんですね。これは扱いやすい。
また、その矩形のスタイルもわたってきます。例えば矢印が黒塗りじゃなく、白塗の場合は<style>Hollow Arrow</style>という風に変わります。
見た目によって意味づけする場合は、ここを見て判定すれば処理を分けられそうですね。
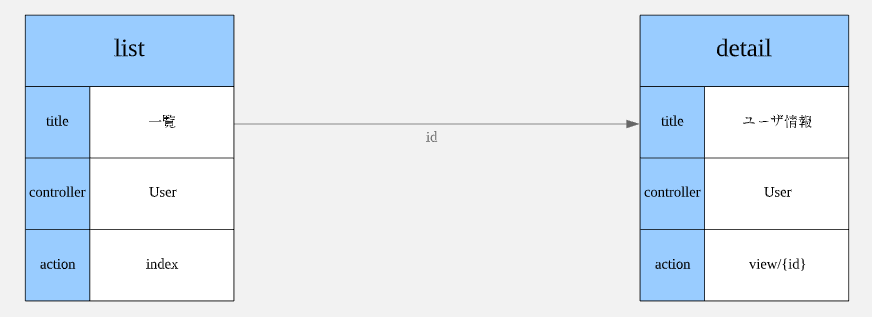
例2 表や矢印に文字を入れた場合
Image

<?xml version="1.0"?>
<document>
  <documentId>xxxxxx-xxxxxxxxxxx-xxxxxxxxxxx-xxxxx</documentId>
  <title>画面遷移</title>
  <version>9999</version>
  <blocks>
    <block>
      <id>r35cov-kQI~U</id>
      <class>DefaultTableBlock</class>
      <textAreas>
        <textArea>
          <key>Cell_0,0</key>
          <value>detail</value>
        </textArea>
      </textAreas>
      <textAreas>
        <textArea>
          <key>Cell_1,0</key>
          <value>title</value>
        </textArea>
      </textAreas>
      <textAreas>
        <textArea>
          <key>Cell_1,1</key>
          <value>ユーザ情報</value>
        </textArea>
      </textAreas>
      <textAreas>
        <textArea>
          <key>Cell_2,0</key>
          <value>controller</value>
        </textArea>
      </textAreas>
      <textAreas>
        <textArea>
          <key>Cell_2,1</key>
          <value>User</value>
        </textArea>
      </textAreas>
      <textAreas>
        <textArea>
          <key>Cell_3,0</key>
          <value>action</value>
        </textArea>
      </textAreas>
      <textAreas>
        <textArea>
          <key>Cell_3,1</key>
          <value>view/{id}</value>
        </textArea>
      </textAreas>
    </block>
    <block>
      <id>AZ5cyTtONMi9</id>
      <class>DefaultTableBlock</class>
      <textAreas>
        <textArea>
          <key>Cell_0,0</key>
          <value>list</value>
        </textArea>
      </textAreas>
      <textAreas>
        <textArea>
          <key>Cell_1,0</key>
          <value>title</value>
        </textArea>
      </textAreas>
      <textAreas>
        <textArea>
          <key>Cell_1,1</key>
          <value>一覧</value>
        </textArea>
      </textAreas>
      <textAreas>
        <textArea>
          <key>Cell_2,0</key>
          <value>controller</value>
        </textArea>
      </textAreas>
      <textAreas>
        <textArea>
          <key>Cell_2,1</key>
          <value>User</value>
        </textArea>
      </textAreas>
      <textAreas>
        <textArea>
          <key>Cell_3,0</key>
          <value>action</value>
        </textArea>
      </textAreas>
      <textAreas>
        <textArea>
          <key>Cell_3,1</key>
          <value>index</value>
        </textArea>
      </textAreas>
    </block>
  </blocks>
  <lines>
    <line>
      <id>~15cXKeTv-KI</id>
      <endpoint1>
        <style>None</style>
        <block>AZ5cyTtONMi9</block>
      </endpoint1>
      <endpoint2>
        <style>Arrow</style>
        <block>r35cov-kQI~U</block>
      </endpoint2>
      <text>id</text>
    </line>
  </lines>
</document>
ポイントは表の情報は<key>Cell_3,1</key>のようにkeyにindexがはいるところと、矢印に文字列を入れた場合は<text>id</text>のように、endpointと同じ階層にtextが登録されるところですね。
というわけで、APIをたたくところまでを紹介しました。 次回は、これをLaravelのコンポーネントに突っ込むところをやろうかなと思います。